
Using Azure DevOps APIs with Power BI
I have started to learn ways to access data in Azure DevOps and was curious how hard it is to extract data using the Azure DevOps API inside Power BI. I knew that I could build integration solutions to augment the Analytics that come out of Azure DevOps into a NoSQL database or Storage Account but was curious how hard it would be to access the API directly and use the data. I figured out how to get data about builds performed in Azure DevOps Pipelines.
Installing Power BI
To install Power BI desktop you will need a Windows-based computer and you should install it from the Windows Store. This is because while the offline installer works it is being discontinued and Power BI requires that you keep up with monthly installs. It is alson really recommended that you install it on Windows 10 versus a Windows Server OS.
Once Power BI is installed and launched you can dismiss the splash screen and select Get Data and Blank Query. Although there is a Get data on the splash screen I find that Power BI desktop has an amazing number of menu options and it can help to see how things are done.
The Power Query Editor
The Power Query Editor window should pop up and this is the main place where you can manage all of your data and queries. On the left you should see a list with only the one empty query named Query1 appearing. Lets start by calling a static web service API for a list of Azure DevOps projects.
- Select the
New Sourcebutton. - Select the
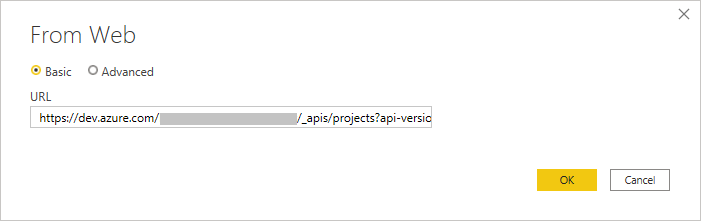
Weboption. - Paste into the URL the following string, replacing in the URL
{organization}for the Name of your organization for Azure DevOps and pressOK.
https://dev.azure.com/{organization}/_apis/projects?api-version=6.0
Setting up credentials for Power BI Desktop
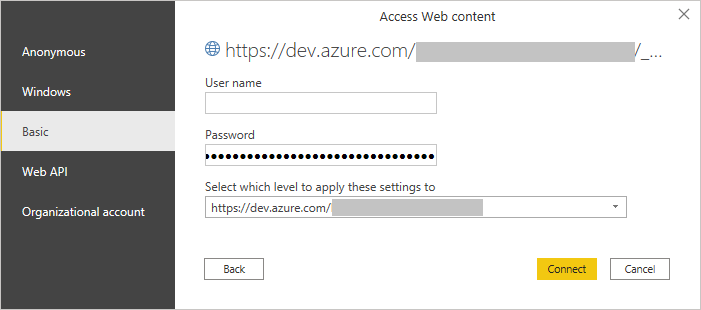
Since we have never connected to this data source we are asked to authenticate. To do this we need to get a Personal Access Token (PAT) for access to our organization. You can head over to Microsoft Docs to learn how to get a PAT for your Azure DevOps org. Once you have a PAT for your organization that has full access at least to read information we will setup Power BI desktop to use the PAT.
- Select
Basicauthentication. - Paste your PAT into the field labeled
Password, leaving the user name blank. - Then leave the level to apply to at
https://dev.azure.comunless you want to select one level down with your organization name included. - Press
Connect
Note: If you apply this PAT at the base URL for the Azure DevOps system it will apply to all organizations and use cases from Power BI. If you select the URL level that has the organization name you can then have additional PATs supplied for different organizations.
Projects List Query
If all goes well you should have a grid showing all of the projects you have access to see in your organization. We can Right Click and select delete on Query1 on the left. Also we should rename our query on the left projects?api-version=6 by right clicking on it and selecting Rename. Let’s call the query Projects.
Now that we have a query lets do some cleanup.
Control selectthe 3 columns value.id, value.name and value.description, then select the buttonRemove Columnsand the optionRemove Other Columns.Double clickthe value.id header and enterid.Double clickthe value.name header and entername.Double clickthe value.description header and enterdescription.
Note: You should note on the right there is a list of steps we have applied. Clicking on each will show the grid transforms step by step. If you make a mistake you can delete one with the little x and then do it again.
Using the Advanced Editor
What we actually were doing is creating a series of transforms using a language called DAX. If you press the toolbar button now called Advanced Editor you can see the steps we applied on the right as the DAX source code. After selecting display options in the upper corner of the editor window and enabling Display line numbers and Enable Word Wrap your window for the Projects query should look something like this…
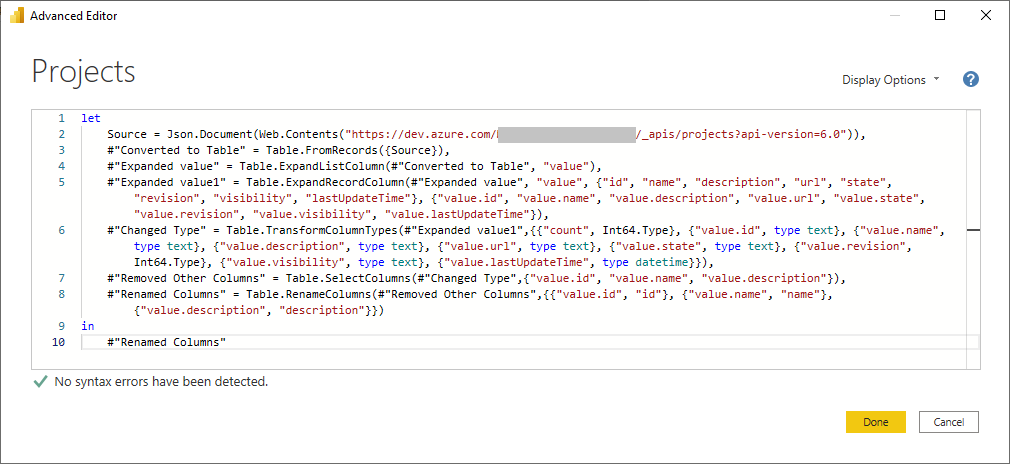
Notice that the applied steps on the right match the left hand side values of each expression line in the DAX syntax. To prove this lets change the text #"Expanded value1" on lines 6 and 6 to say #"Expanded project columns" and press Done. On the right you should see that that step has now changed names. Go back into the advanced editor. What we are seeing on the left hand side are transforms held in variables. The output of a DAX command is assigned to a variable, then on the next line or a later line that variable may be provided to a later command as input which creates another output variable. At the end the in clause chooses which variable we are outputting from the query.
Note: In DAX a variable can be a word without spaces like other programing languages or you can use the
#"Text"format to provide multiple word variables. I think it is really up to you which to use but the wizards like to use the multiple word style of variables for every variable except the first one which it usually names Source.
So what are each of these lines doing?
- The
letstatement indicates the sequence of steps will begin. - The
Web.Contentsfunction calls a Web resource like our API and returns the contents, it is basically doing a GET. Then the output of that text document is fed into theJson.Documentfunction to convert it into a Json document named Source. If you close the advanced editor and select just the source step you will see what is returned is a List collection. This collection is is all the project Json nodes from the API response. You can return at any time to the advanced editor by selectingHometab and thenAdvanced Editorwhen in the Power Query Editor. - The
Table.FromRecordsconcerts the Json object array into a Table which is the goal of queries usually to produce tables for reporting. - The
Table.ExpandListColumntakes the list named value and converts it into a table of record types which are basically structures of other structures and values. - The
Table.ExpandRecordColumnfunction takes the record objects in the value column of our table and expands them all into their own columns. - The
Table.TransformColumnTypefunction converts each column into the correct data type from the text the Json represented the data as in the result. - The
Table.SelectColumnsfunction we added when we did the remove columns command to only select the three columns we wanted. - The
Table.RenameColumnsfunction we added when we clicked on each column header and renamed the columns. - The
inclause indicates the query result - The final line
#"Renamed Columns"lets the in clause know which transform variable to output, in this case the last step.
We need to get conformable going into the Advanced Editor and working with the DAX syntax because when you work with APIs you will find that there are just some things that you need to do that are easier to type in versus using the designer to build.
Let’s press the Close & Apply button to save our query and exit the Power Query Editor. Power BI should go out now and get all of the data and add it to your model. You can see this by selecting the Data button  on the left side of Power BI desktop. Its also probably a good time to do a
 File, Save As and save our work as a .pbix file, I named my AzureDevOpsAPI.pbix.
Build List Query
If you go to the Azure DevOps API and look for a list of builds you will notice that the URL is similar but requires now an Azure DevOps project.
https://dev.azure.com/{organization}/{project}/_apis/build/builds?api-version=6.0
We know now how to create an API query so lets make an API query for our of our Project’s by substituting both the Organization and Project names.
- Select
Transform dataandTransform datato go back into the Power Query Editor. - Select
New SourceandWeband paste in the URL for builds editing the organization and project to be valid names for our organization. - Rename the query __builds?api-version=6 to
BuildsExample. - Launch the advanced editor and replace this complex result with something a bit simple to work with for now…
Remember to change ORGNAME and PROJECTNAME to your Azure DevOps Organization and Project names.
let
    Source = Json.Document(Web.Contents("https://dev.azure.com/ORGNAME/PROJECTNAME/_apis/build/builds?api-version=6.0")),
    #"Converted to Table" = Table.FromRecords({Source}),
    #"Removed Count Column" = Table.RemoveColumns(#"Converted to Table",{"count"}),
    #"Expanded Value" = Table.ExpandListColumn(#"Removed Count Column", "value"),
    #"Selected Columns" = Table.ExpandRecordColumn(#"Expanded Value", "value",
        {"buildNumber", "result", "queueTime", "startTime",
         "finishTime", "project", "sourceBranch"},
        {"value.buildNumber", "value.result", "value.queueTime",
         "value.startTime", "value.finishTime", "value.project", "value.sourceBranch"}
    ),
    #"Selected Project Columns" = Table.ExpandRecordColumn(#"Selected Columns", "value.project",
        {"id", "name"},
        {"value.project.id", "value.project.name"}),
    #"Renamed Columns" = Table.RenameColumns(#"Selected Project Columns",
    {
        {"value.buildNumber", "buildNumber"},
        {"value.result", "result"},
        {"value.queueTime", "queueTime"},
        {"value.startTime", "startTime"},
        {"value.finishTime", "finishTime"},
        {"value.project.id", "project.id"},
        {"value.project.name", "project.name"},
        {"value.sourceBranch", "sourceBranch"}
    }),
    #"Changed Type" = Table.TransformColumnTypes(#"Renamed Columns",
    {
        {"queueTime", type datetime},
        {"startTime", type datetime},
        {"finishTime", type datetime}
    })
in
    #"Changed Type"
We should close and apply our queries and save our report in Power BI desktop.
Calling APIs in loops
One thing I wondered as I was looking at this build API is how I could deal with multiple projects since the API requires the project name be part of the API call. My Azure DevOps organization has many projects inside it and I would like my builds data to contain data from each of the projects so I can do cross project slicing and display of data if needed.
The solution to this is quite interesting you make a query into a function (or a subroutine) and then call it from another query as a transformation step. This super powerful composition can allow you to join lots of different logic together. So for our builds query what we want to do is the following:
- Make our builds example query into a parameterized function that takes an azure devops project name as an argument.
- Make a new query that queries the project’s API to get a list of project’s.
- Extend that query to take each project and call our function query passing the project name.
- For any query for a single project that returns results we can append the results together.
Creating our parameterized builds query
- Select
Transform dataandTransform datato go back into the Power Query Editor. - Select the BuildsExample query and select
advanced editor. - Copy all the syntax of our “builds”
- Select
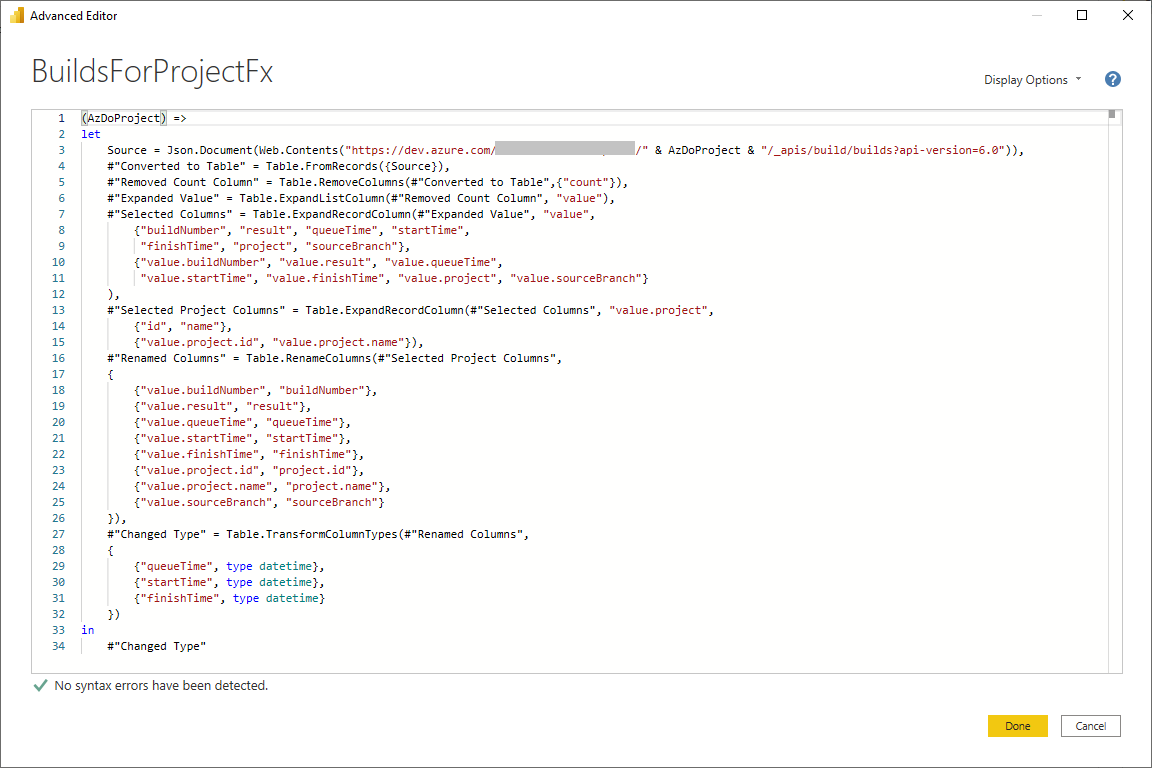
New SourceandBlank Queryand paste in our syntax from the example query. - Add the following syntax to the top of the query on line before the let.
(AzDoProject) =>
- Replace in the what is now line 3 your project name for this syntax
" & AzDoProject & "
- Press Done.
- Rename the function Query1 on the left to BuildsForProjectFx
What we did is we changed the logic from a query to a function that is passed one argument named AzDoProject. Then we changed the URL string to concatenate the variable in the URL replacing a single project name. Our function should now look like the following, with your organization name.
Creating the Builds Query
Now that we have a function we need to query the project’s API for project’s and then call the builds API and append the data.
- Select
New SourceandBlank Queryin Power Query Designer. - Select
Advanced Editorand lets create a table of just project names by calling the Azure DevOps Project API. Remember to change theORGNAMEto your organization name.
let
    #"Projects" = Json.Document(Web.Contents("https://dev.azure.com/ORGNAME/_apis/projects?api-version=6.0")),
    #"Project List" = #"Projects"[value],
    #"Project Table" = Table.FromList(#"Project List", Splitter.SplitByNothing(), null, null, ExtraValues.Error),
    #"Project Names" = Table.ExpandRecordColumn(#"Project Table", "Column1", {"name"}, {"Column1.name"})
in
    #"Project Names"
If you press done right now you should get a table with one column showing all the project names in your organization. Now that we have that we are going to call the function for each of those names and append the results together.
- Open up the query again with the
Advanced Editor. - Add a comma at the end of line 5 and then paste these lines into the editor.
    #"Project Builds" = Table.AddColumn(#"Project Names", "Builds", each BuildsForProjectFx([Column1.name])),
    #"Project Builds No Errors" = Table.RemoveRowsWithErrors(#"Project Builds", {"Builds"}),
    #"Project Builds Remove Input" = Table.RemoveColumns(#"Project Builds No Errors",{"Column1.name"}),
    #"Build Column Names" = Table.ColumnNames(#"Project Builds Remove Input"{0}[Builds]),
    #"All Builds Raw Data" = Table.ExpandTableColumn(#"Project Builds Remove Input", "Builds", #"Build Column Names"),
    #"All Builds" = Table.SelectRows(#"All Builds Raw Data",
        each not List.IsEmpty(List.RemoveMatchingItems(Record.FieldValues(_), {"", null})))
- Replace the last line
#"Project Namesto be#"All Builds" - Press
Doneand answer the data privacy question for combining data, for now you should be able to selectPublic. - Rename Query1 as
Builds
What this additional code after we get the list of project names is doing is the following:
- Add a column to our project names table called “Build” with the entire output of calling our function with the project name.
- Remove any rows that have errors in them if the API gives back an error when we call the function.
- Remove our project name input column we used for the loop as we don’t need it going forward.
- Get a list of all the build table column names returned from the function.
- Expand the returned build columns into our table using the names we looked up.
- Remove any rows that are all nulls, this can happen if no builds have occurred in a project.
- Return the combined list of builds.
The query should look like this now with your ORGNAME
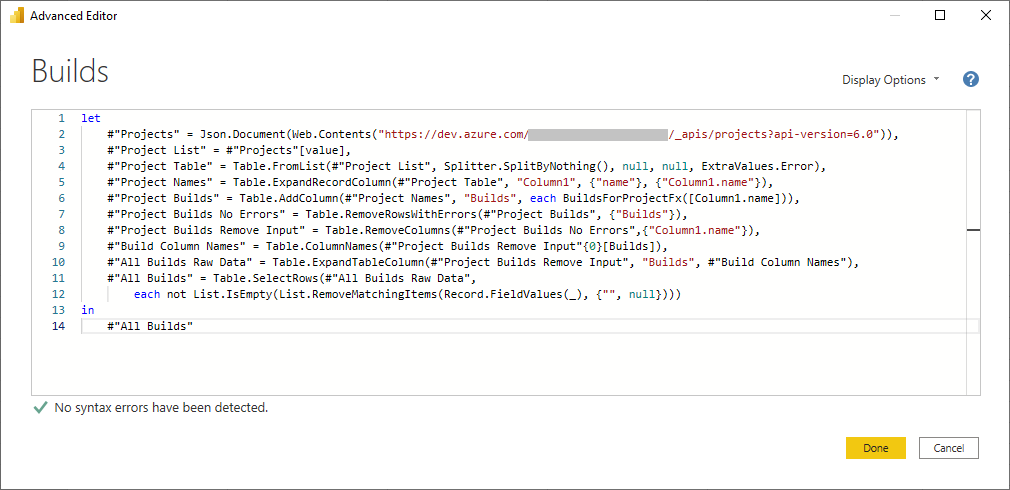
We can delete the BuildsExample query, apply our results and close the Power Query Designer.
Linking the project’s query to the builds query
Once the Power Query Designer is closed you can select the Model button  in Power BI Desktop. If you drag the
 id column of Projects to the project.id column of Builds we can link these two queries together for filtering.
One other thing we should do is select the startTime in the model view and change the its Data type to Date/time. This will help with formatting it in reports as a date since we didn’t do the data type conversion in our model.
Then we can select the Report button  and we can make a simple graph with a slicer.
Reporting on builds
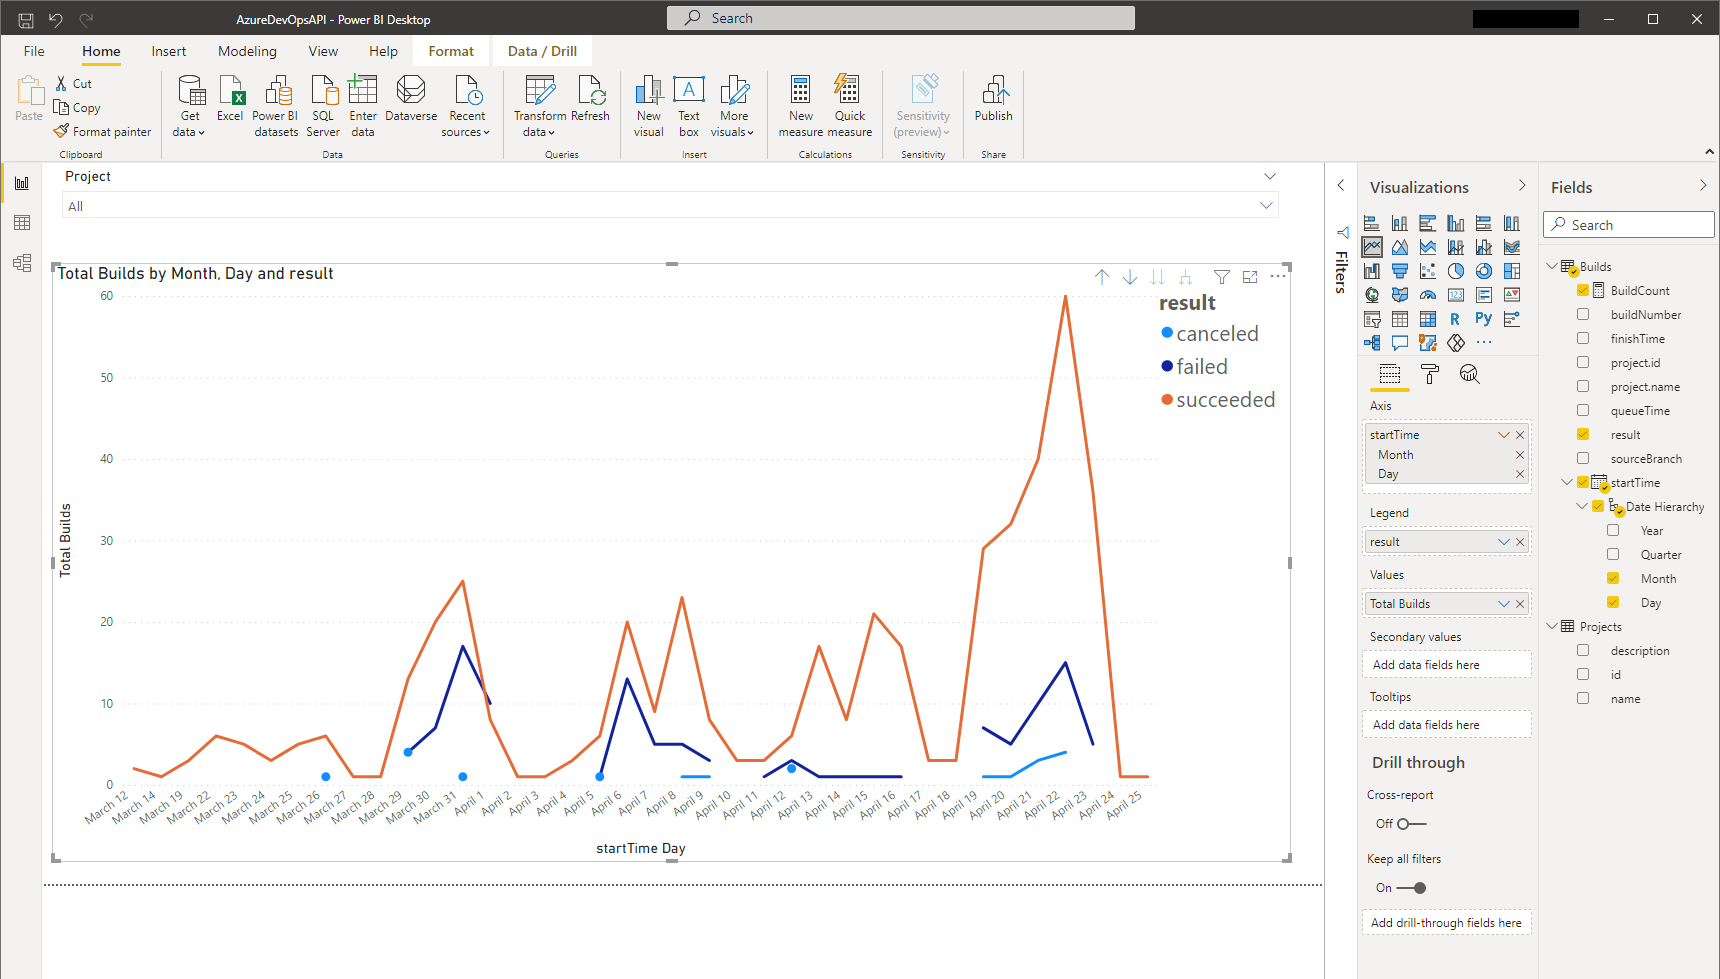
- In the reports view add a line chart.
- Select under
Fieldsthe builds and add right click and addNew Measureentering the formula
BuildCount = COUNT(Builds[buildNumber])
- Put the start time date hierarchy month and day as the
Axisof the line chart. - Put the Buildcount as the
Valuesof the line chart and double click to rename itTotal Builds - Add the result from builds as the
Legend. - If you want you can add a slicer to select the project name to decide which projects are in your chart.
You should now with a little formatting have a dashboard showing builds by result per day that you can filter by projects. All of this data is coming to Power BI from the Azure DevOps API.
Although we had to get a little deep into DAX language and work with how the Azure DevOps API presents us data I found that it is very straightforward to expose a lot of information into Power BI by just using the API. I imagine that some APIs might have challenges that we need to work around but by using that compositional pattern of function based queries I am sure we could handle almost any API.
Happy Reporting and Dashboarding…
-Paul